
What your EV really costs to charge: measure the first month
Keep a simple record of distance, dashboard consumption and charging-meter readings. A worked monthly example shows why these numbers differ and how to calculate a useful rupees-per-kilometre figure.
The car says it used 15 kWh per 100 km. The electricity bill has gone up by more than that calculation suggested. Before blaming the car, check what each number measures.
The dashboard, charger and NEA bill describe different parts of the same month. The dashboard usually reports energy associated with driving, according to the manufacturer's definition. A charging meter records electricity at its own measurement point. The household bill includes everything connected to that meter.
You can learn a lot in four weeks without buying laboratory equipment. Keep the boundaries consistent, record charging that happens away from home, and resist turning one unusually economical trip into a monthly estimate.
Start with units you can compare
Some cars display kWh/100 km; others use Wh/km. The Tata Punch EV manual supplied by Sipradi, for example, describes trip-average energy in Wh/km. Check your own car's units and reset behaviour.
A reading of 150 Wh/km is 15 kWh/100 km. Multiply Wh/km by 0.1 to make that conversion. A reading of km/kWh goes the other way: divide 100 by that number to obtain kWh/100 km. Thus 6.25 km/kWh means 16 kWh/100 km.
Write down the unit alongside the value. A spreadsheet containing only "150" and "15" can make the same consumption look ten times different.
Make a record that survives a busy week
Record the odometer and charge percentage before the first journey. Record them again at the end of the month. Try to finish at a similar charge level, with charging sessions fully counted. Otherwise, some electricity bought this month may remain in the battery for next month's journeys, or this month may consume energy bought earlier.
A dedicated, properly installed charging meter is helpful. Its installation and suitability are work for a qualified electrician; this guide does not suggest modifying the NEA meter. Charger-app totals are another option, provided you know where and how the equipment measures energy.
For every public session, save the receipt and its kWh figure. Keep its rupee amount separately because fees and rates can differ. If the car charges at a relative's house, record that too. Missing one large session can make home charging appear remarkably efficient.
A usable weekly log needs only a few columns:
| Record | Why it matters |
|---|---|
| Start/end odometer | Gives actual distance, including small errands |
| Start/end charge percentage | Flags unequal battery-energy boundaries |
| Trip-average consumption and its unit | Preserves the dashboard's own measurement |
| Home charging kWh | Separates charging from household appliances |
| Public and other charging kWh | Prevents missing sessions |
| Charging payments | Allows a cost calculation independent of energy |
| Route, load and unusual parking use | Helps explain changes next month |
Take readings while parked. A passenger can help with notes; the driver should not photograph the instrument panel in traffic.
A month of invented readings
The following dataset is an illustration, not an owner survey or a road test. Assume all charging is measured on a consistent basis, the opening and closing battery energy are approximately matched, and no session is missing.
| Week | Distance | Dashboard driving energy | Charging-meter energy | Dashboard kWh/100 km | Meter kWh/100 km |
|---|---|---|---|---|---|
| 1 | 180 km | 27.0 kWh | 31.5 kWh | 15.00 | 17.50 |
| 2 | 220 km | 33.0 kWh | 38.2 kWh | 15.00 | 17.36 |
| 3 | 200 km | 32.0 kWh | 36.8 kWh | 16.00 | 18.40 |
| 4 | 240 km | 36.0 kWh | 41.4 kWh | 15.00 | 17.25 |
| Month | 840 km | 128.0 kWh | 147.9 kWh | 15.24 | 17.61 |
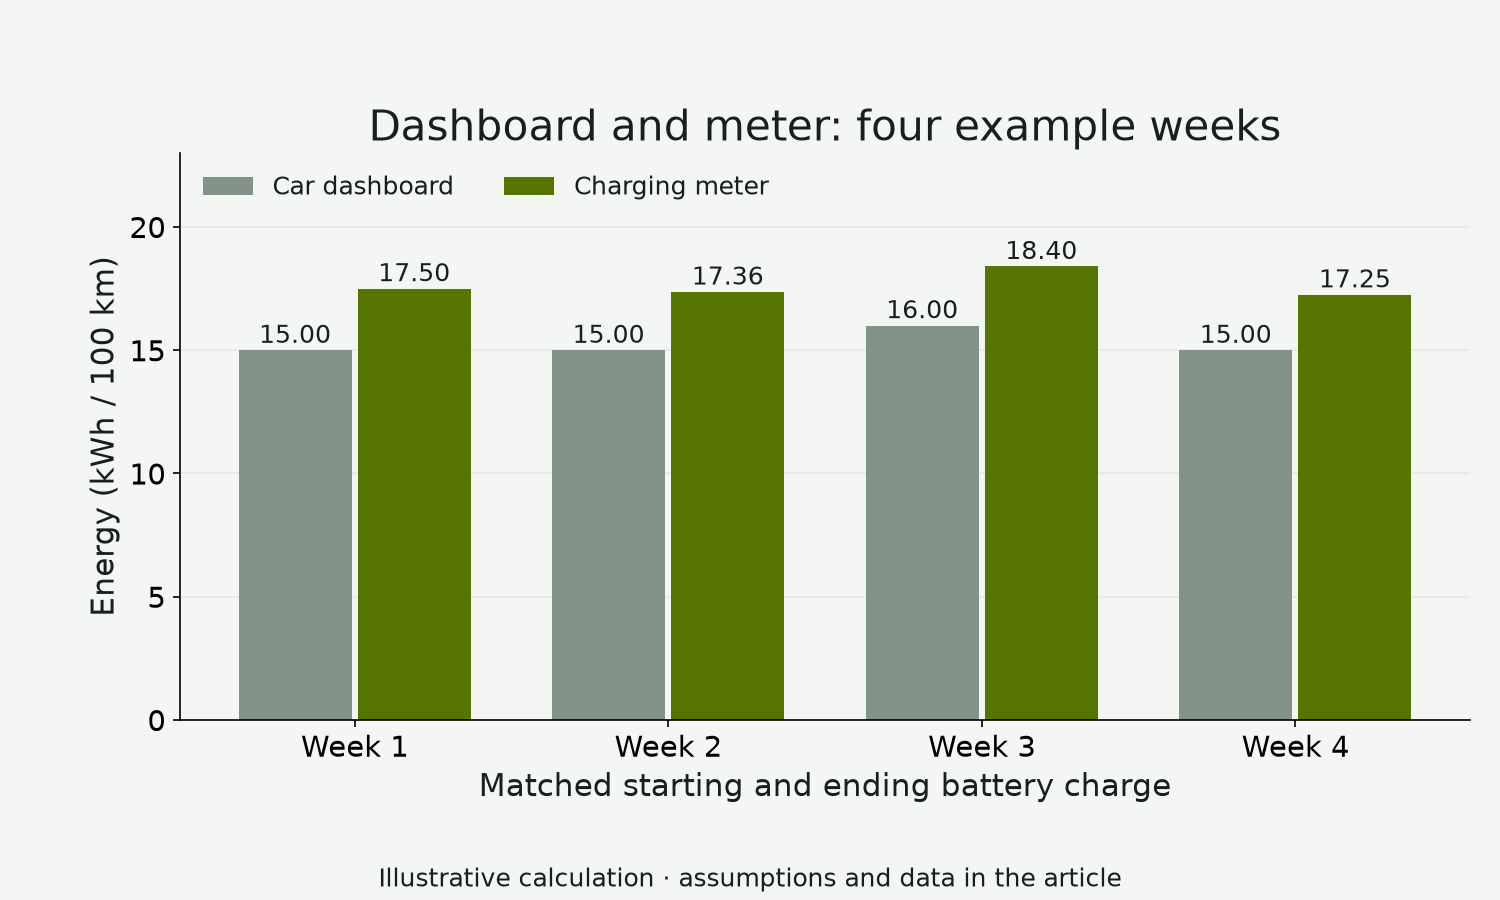
Original BijuliMotor example. Each bar uses the corresponding weekly distance in the table. The difference between readings is not a measured charging-loss percentage.
For the monthly consumption, divide total energy by total distance, then multiply by 100. Do not average four weekly rates without accounting for their different distances. Here the month is 147.9 ÷ 840 × 100 = 17.61 kWh/100 km at the charging meter.
What explains the gap?
Charging involves energy conversion and supporting equipment. Some energy may also be used while the car is parked. Dashboard definitions, meter accuracy, rounding and mismatched opening/closing battery energy can create further differences.
ADAC's charging-loss measurements demonstrate that energy delivered during charging and energy retained in the battery need not match. Their tested vehicles and conditions do not establish a loss percentage for your car in Nepal.
In our example the two monthly totals differ by 19.9 kWh. Calling all 19.9 kWh "charging loss" would overstate what the log proves. A household record does not isolate every source of energy use or measurement error.
That distinction matters if you are comparing a slow AC setting with another charging method. Keep the starting/ending charge level, distance and other conditions comparable over repeated observations. A single session with battery cooling or a different charge boundary is a weak basis for declaring one method cheaper.
Turn the record into rupees
At an assumed flat Rs 12/kWh, the example's 147.9 kWh costs Rs 1,774.80, or about Rs 2.11/km. Using dashboard energy alone gives Rs 1,536, or Rs 1.83/km. The smaller figure leaves out electricity represented by the difference between those measurements.
Rs 12 is an arithmetic input, not a current NEA tariff quote. Domestic bills can use slabs and service charges. Public charging can include session or parking fees. For a mixed month, add the actual charging payments and divide by the month's distance; state separately how you allocated the home bill.
Do not divide the whole household bill by car kilometres. Cooking, water heating and other loads belong in that bill too. Our home-charging guide explains installation planning; a measured charging record answers the later question of what the car used.
Use the second month to ask better questions
Compare broadly similar periods. A month with a long hill trip and five passengers should not be judged against a month of short solo journeys. Record tyre-pressure maintenance, major temperature changes, long queues and any service work without assuming they explain the whole difference.
If consumption changes sharply, check missing sessions, units and battery boundaries first. If the record is sound and the change continues, take it to the service centre with the dates and conditions. An unexplained spreadsheet gap is evidence to investigate, not a diagnosis of battery failure.
After a few consistent months, you will have a useful household number: how much charging costs for the journeys you actually make. Keep the dashboard reading as well. The two measurements answer different questions, and both are more useful when their limits are visible.