
Highway speed and EV range in Nepal: a worked example
A flat-road model for the BYD Atto 3 shows why 90 km/h uses 31% more energy than 50, and what that means for the 201 km run to Pokhara.
A BYD Atto 3 Advanced uses about 11.9 kWh per 100 km at a steady 50 km/h in a flat-road model. At 90 km/h the same model uses 15.6 kWh, so its 49.92 kWh battery covers about 321 km instead of 420 km. That's 31% more energy for the same distance, before hills, wind or a full load.
The model is arithmetic. No car was driven to produce it. It uses the Atto 3's catalogue battery and WLTP range, the kerb weight from EV Nepal's specification table, and stated assumptions for drag, rolling resistance and accessory load. No measured Kathmandu–Pokhara consumption for this car could be confirmed. EV Nepal's review reports 290–315 km in mixed Nepali use for the Advanced, which implies 15.8–17.2 kWh per 100 km. The model's 90 km/h result sits just below the lower end of that consumption range, so treat the flat-road figures as a best case.
The car and the route
The Atto 3 Advanced is listed at Rs 62,90,000 in the BijuliMotor catalogue, with a 49.92 kWh battery and a 345 km WLTP claim. EV Nepal's Atto 3 specification table gives a kerb weight of 1,680 kg, a body width of 1.875 m and a height of 1.615 m. It also lists a 100 kW motor and a 105 kW CCS2 DC inlet.
The route used later is the Prithvi Highway from Kalanki to Pokhara, about 201 km. BijuliMotor's Kathmandu–Pokhara route guide splits it into five legs using OpenStreetMap routing checked on 23 October 2026. The same routing gives the valley exit an average of 26 km/h and the Malekhu to Mugling leg 66 km/h. Those are free-flow model averages. Actual traffic on the day will differ.
What the car spends energy on
Three loads matter at a steady speed. Rolling resistance comes from the tyres and the weight on them. It costs roughly the same energy for each kilometre whatever the speed. Air resistance rises with the square of the speed, so its share grows quickly. Accessories such as air-conditioning, lights and screens use power by the hour, so a slower trip spends more time running them.
NASA's drag equation gives the relationship: drag force is half the air density times the drag coefficient times the frontal area times the square of the speed. That equation is general physics. It isn't a Nepal test result. For a driver, doubling the airspeed quadruples the drag force.
In the model, air resistance uses more energy than rolling resistance above about 86 km/h. At 50 km/h the battery energy split is about 6.6 kWh per 100 km from rolling and 2.2 kWh from air. At 90 km/h it is 6.6 kWh from rolling and 7.2 kWh from air. The total rises even though the rolling part stays put.
Accessories work the other way. With an assumed 1.5 kW load, two hours use 3 kWh. On a 100 km trip that is 3 kWh per 100 km at 50 km/h, but only 1.5 kWh per 100 km at 100 km/h. So the model's lowest consumption falls around 45 km/h. Driving slower than that uses more energy. Below that point, the time spent running the air-conditioning and electronics costs more than the air resistance saved.
Inputs and assumptions
| Input | Value | Where it comes from |
|---|---|---|
| Battery capacity | 49.92 kWh | BijuliMotor catalogue, gross capacity |
| Running mass | 1,830 kg | 1,680 kg kerb from EV Nepal, plus 150 kg for driver, passenger and luggage (assumption) |
| Drag coefficient | 0.29 | Assumption; no Nepal brochure figure could be confirmed |
| Frontal area | 2.25 m² | Assumption from the body size (1.875 m wide, 1.615 m tall) |
| Drag coefficient × area | 0.65 m² | Product of the two assumptions above |
| Rolling resistance coefficient | 0.012 | Assumption for road tyres |
| Air density | 1.15 kg/m³ | Assumption at low altitude; thinner air on hill roads would reduce drag |
| Drive efficiency | 90% | Assumption, road load to battery energy |
| Accessory load | 1.5 kW | Assumption for air-conditioning, lights and electronics |
| Road and conditions | Level, no stops, no wind | Model scope |
The model multiplies each force by 100 km and converts joules to kWh. It divides the rolling and air loads by 0.9 for drive efficiency, then adds the accessory energy, which comes from the battery directly. It doesn't include charging losses, battery heating or cooling, or the energy used to accelerate the car. Those omissions make it optimistic.
The result at each speed
| Steady speed | Battery energy per 100 km | Range on 49.92 kWh | Energy for 201 km |
|---|---|---|---|
| 40 km/h | 11.8 kWh | 422 km | 23.8 kWh |
| 50 km/h | 11.9 kWh | 420 km | 23.9 kWh |
| 60 km/h | 12.4 kWh | 404 km | 24.9 kWh |
| 70 km/h | 13.2 kWh | 379 km | 26.5 kWh |
| 80 km/h | 14.2 kWh | 351 km | 28.6 kWh |
| 90 km/h | 15.6 kWh | 321 km | 31.3 kWh |
| 100 km/h | 17.1 kWh | 292 km | 34.3 kWh |
| 110 km/h | 18.8 kWh | 265 km | 37.8 kWh |
The 49.92 kWh figure is gross capacity. If the usable part is smaller, the range column falls in proportion.
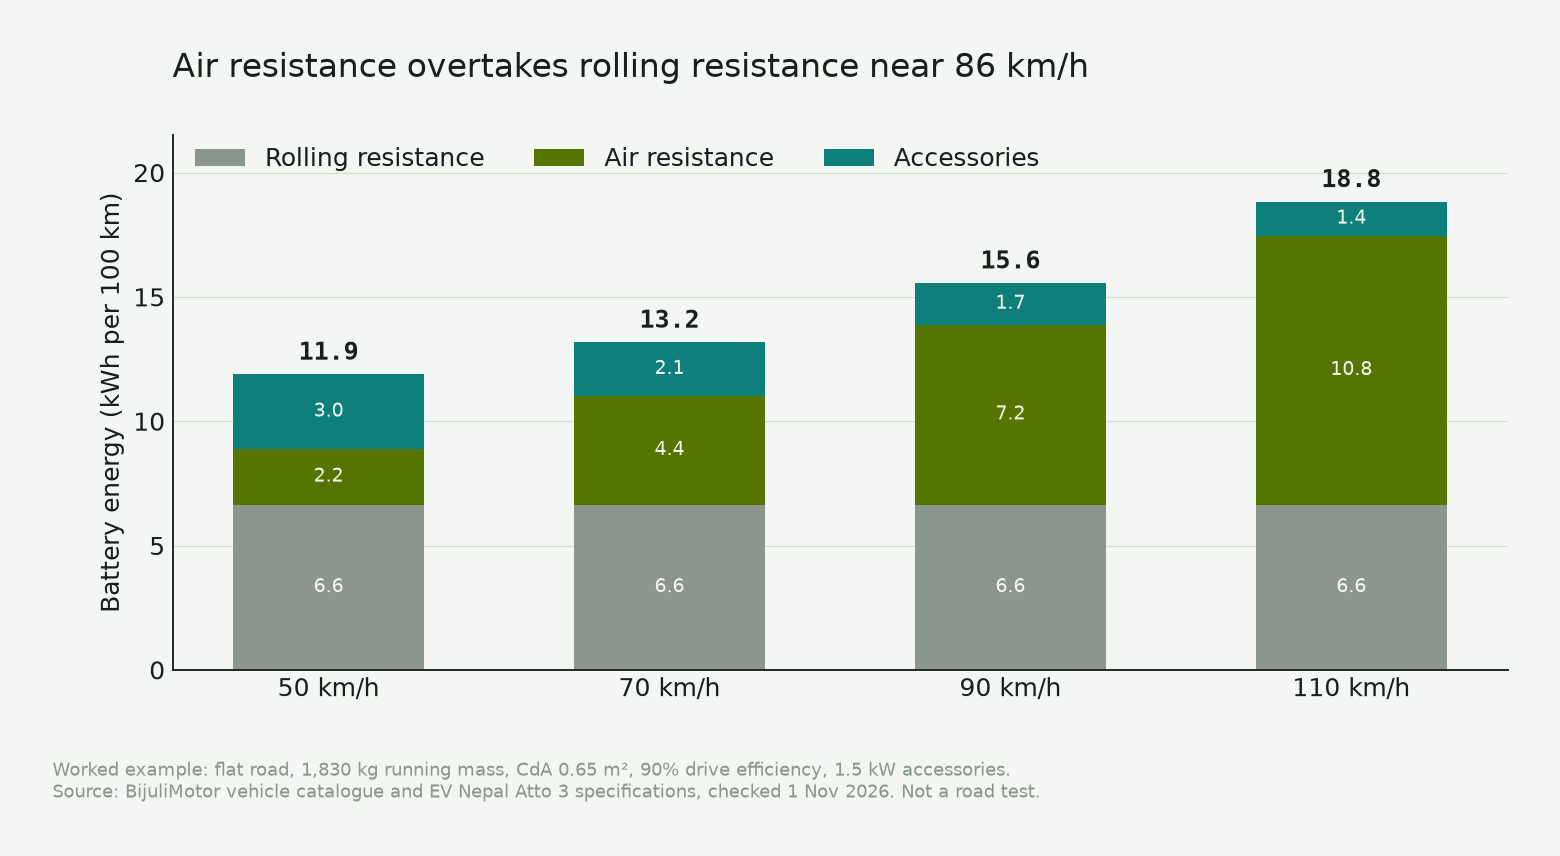
The jump from 50 to 90 km/h is 3.7 kWh per 100 km, or 31%. The same battery therefore gives 99 km less range. From 80 to 100 km/h the increase is 20%, and from 90 to 110 km/h it is 21%. The penalty grows faster at the top of the range because the air term is squared.
These are constant-speed figures. A real drive includes acceleration, braking, gradients and traffic, so no single row describes a Kathmandu–Pokhara trip. Read the table for the direction and size of the change. It cannot predict your arrival charge.
How the model compares with a Nepal review
EV Nepal's review, published on 2 October 2026, reports 290–315 km of mixed Nepali use for the Advanced and 17–19 kWh per 100 km. Those two statements don't quite agree with each other: 290–315 km from a 49.92 kWh pack works out to 15.8–17.2 kWh per 100 km, while the review's separate efficiency estimate is 17–19. The review is a journalistic estimate without a logged test behind it, and the difference is one reason to treat any single consumption figure with care.
The model's 15.6 kWh per 100 km at 90 km/h is close to the efficient end of that mixed-use range, so the flat-road result is optimistic rather than conservative. It isn't a promise for a hilly route. If the car uses 17–19 kWh per 100 km in mixed use, 201 km needs 34.2–38.2 kWh, or 69–77% of the battery. The flat-road model at 90 km/h needs 31.3 kWh, or 63%.
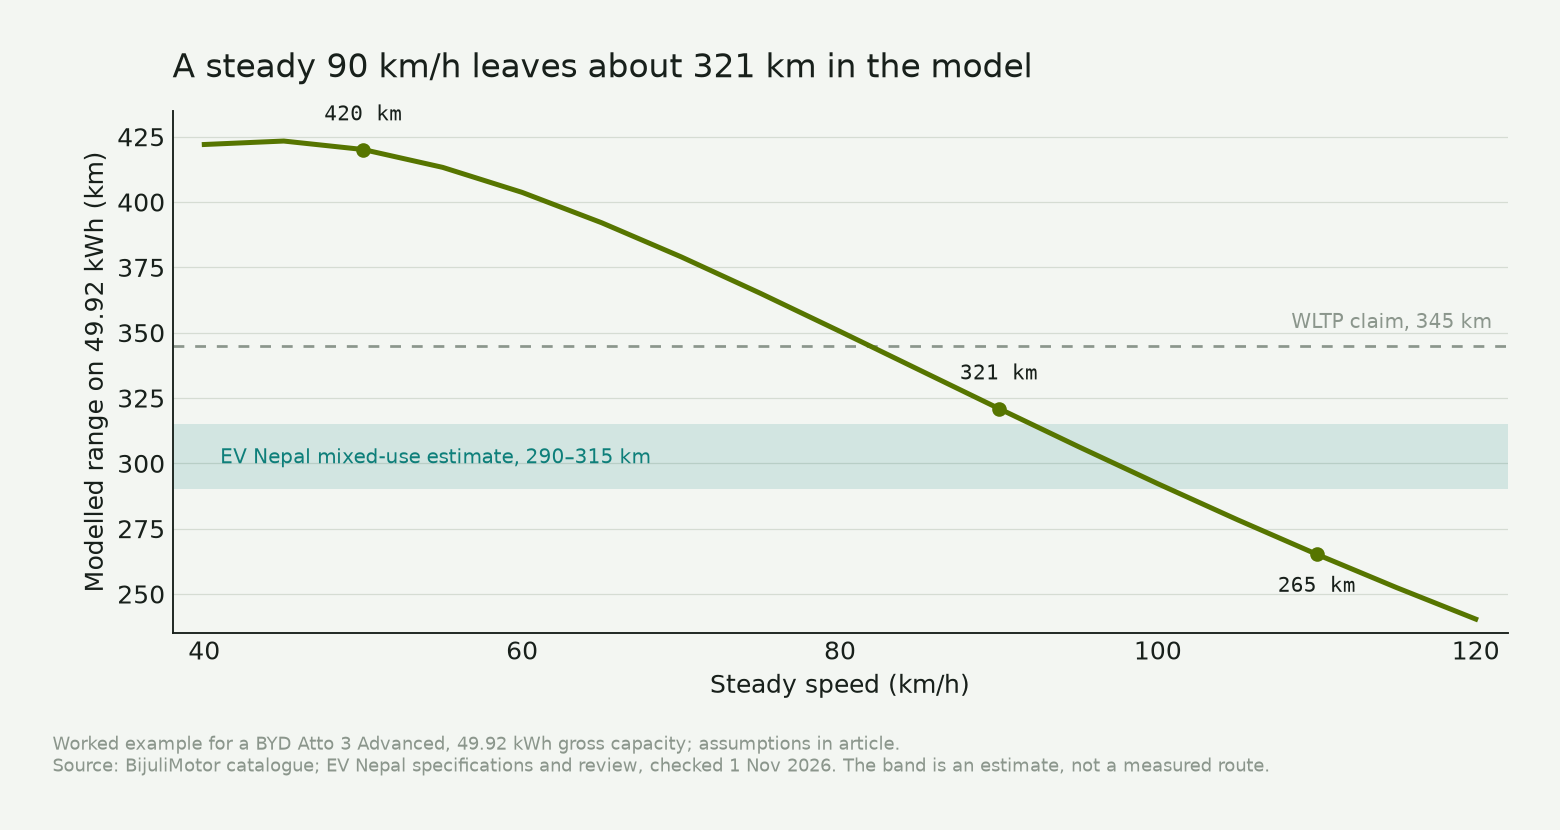
The WLTP claim of 345 km and the model's steady-speed range measure different things. WLTP includes stops, accelerations and a test temperature. A steady 80 km/h in this model gives about 351 km, close to the 345 km claim, but that coincidence doesn't make WLTP an 80 km/h test. Read why the test label matters before comparing a brochure figure with a trip estimate.
On the road to Pokhara
At 50 km/h the model needs 23.9 kWh for the 201 km route. At 90 km/h it needs 31.3 kWh. Starting full, that is 48% of the battery at the lower speed and 63% at the higher one. Starting at 90%, with a 20% reserve, the usable window is 34.9 kWh, so the 90 km/h case leaves about 3.7 kWh of margin. That is roughly 24 km at the same consumption, before any climb, headwind or detour.
A climb changes that margin. Lifting 1,830 kg by 1,000 m needs about 5.0 kWh of potential energy, or 5.5 kWh from the battery after the 90% drive efficiency. The Atto 3 will recover some of that on the way down through regeneration. Some of the energy is lost. The regenerative-braking guide explains why a downhill section returns only part of the climb's energy.
The route guide therefore uses 20 kWh per 100 km as a planning assumption. The flat-road model's 15.6 is a separate figure. At 20 kWh per 100 km, 201 km needs 40.2 kWh, which is 81% of the pack. That leaves little room for a headwind, a loaded car or a detour to a charger. A top-up at Kurintar (99 km) or Damauli (151 km) is the practical choice, even though the flat-road model says the car could finish without one.
The valley exit averages 26 km/h in the routing model and the Malekhu to Mugling leg 66 km/h. A driver who spends part of the trip at 90 km/h and part at 30 km/h doesn't get the 90 km/h row. Trip consumption will sit somewhere between the rows, plus the cost of climbs and stops.
Hills, wind and load
A headwind raises the speed of the air over the body above the speed on the dashboard. At 80 km/h into a 20 km/h headwind, the airspeed is 100 km/h. The drag force is about 56% higher than in still air, because 100 squared divided by 80 squared is 1.56. A tailwind reduces it. A crosswind is more complicated and can affect stability, so it isn't a simple subtraction from road speed.
A roof box or a bike rack changes the shape as well as the weight. The luggage and roof-box guide covers the payload limits and the charging effect. If you add a box, expect the model's drag assumption to be wrong in the expensive direction.
Tyre pressure and tyre choice also move rolling resistance. A soft tyre or a coarse surface can raise it. The model uses one coefficient for all conditions, so it can't tell you how much a particular road costs. Check pressures before a long trip. A route you drive often will give you a better figure than a single trip.
Build your own record
Record the distance, the charge at the start and end, the displayed consumption, the number of people and bags, the weather and whether the air-conditioning was on. Note any long delay or detour. A passenger can take the readings, or you can note them once parked. Don't read the screen while driving.
The trip planner starts from 80% of the published range and an 80% charge target. Those are starting defaults. Change them to match your own records. The planner also uses an approximate route distance, so check its total against the road you will drive.
The charging directory is a list. It cannot show live availability. It has 392 records checked on 23 September 2026. Of those, 68 name a CCS2 connector with a DC rating: 49 at 30 kW and 19 at 60 kW. The Atto 3's 105 kW peak is above every one of them. That doesn't change the energy a trip uses, but it changes how long a top-up takes. Call the operator before you rely on a site.
FAQ
Does driving slower always use less energy?
No. In this model, consumption is lowest around 45 km/h. Below that, the time spent running accessories costs more than the air resistance saved. Above it, air resistance dominates. Traffic, safety and the posted limit still decide your speed.
How much range does 90 km/h cost?
For the Atto 3 Advanced, the model gives 321 km at a steady 90 km/h against 420 km at 50 km/h, a 31% increase in energy per kilometre. EV Nepal's mixed-use estimate of 290–315 km is lower, so use the model for the size of the change. It cannot promise a range.
Can an Atto 3 reach Pokhara without charging?
The flat-road model says yes at 90 km/h, using 31.3 kWh of the 49.92 kWh pack for 201 km. The route has climbs, and the route guide's 20 kWh per 100 km planning figure needs 40.2 kWh. A top-up at Kurintar or Damauli is the safer plan, especially with a full car or bad weather.
Is 110 km/h better because the trip takes less time?
No. The trip is shorter in minutes, but each kilometre costs more energy. The model needs 37.8 kWh for 201 km at 110 km/h against 23.9 kWh at 50 km/h. Accessories run for less time, but that saving is small next to the rise in air resistance.
Sources and checks
- BijuliMotor vehicle catalogue: BYD Atto 3 Advanced, 49.92 kWh, 345 km WLTP, Rs 62,90,000. Checked 1 November 2026.
- EV Nepal, BYD Atto 3 price and specifications: kerb weight 1,680 kg, dimensions, battery, WLTP range and DC rating. Checked 1 November 2026.
- EV Nepal, BYD Atto 3 review, published 2 October 2026: mixed-use range 290–315 km and 17–19 kWh per 100 km for the Advanced; around 250 km at a steady 120 km/h in the Superior. Checked 1 November 2026.
- NASA Glenn Research Center, modern drag equation: the drag relationship used in the model. Checked 1 November 2026.
- BijuliMotor, Kathmandu to Pokhara route guide, updated 28 October 2026: 201 km from Kalanki, five legs, OSRM routing checked 23 October 2026, and the 20 kWh per 100 km planning assumption.
- BijuliMotor charging directory, 392 records checked 23 September 2026: 68 CCS2 records with a DC rating, 49 at 30 kW and 19 at 60 kW. It's a directory. It cannot tell you whether a charger is free right now.
- The flat-road model, its inputs and its arithmetic are set out above. No measured consumption for a specific car on the full Kathmandu–Pokhara route could be confirmed.